MaxDiff Analysis
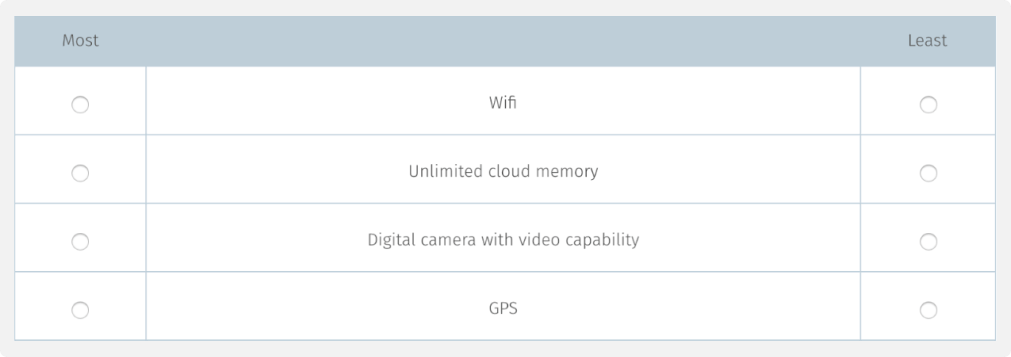
If you are looking to measure preferences for things such as product features, services, and brands in order to understand how your target audience prioritizes various attributes, then you may want to consider running a MaxDiff analysis.
MaxDiff is an approach for obtaining preference and importance scores for multiple attributes. Although MaxDiff shares much in common with conjoint analysis, it is easier to use and applicable to a wider variety of research situations. MaxDiff is also known as "best-worst scaling."
Maxdiff can be used for


Let’s assume a scenario where you are a company considering producing smartphones. You will want to know which features your prospective customers will need on their phones with an understanding of how they prioritize these features in their buying decision. From the list, which ones are required or nice to haves? The organization needs to understand how different customers value and prioritize certain attributes over others. Armed with this information, the smartphone company can then create a range of smartphone offering that meets various market needs.

Research has shown that MaxDiff scores demonstrate greater discrimination among attributes and between respondents on the attributes than standard rating scales and matrix tables..Since respondents make choices rather than expressing strength of preference using some numeric scale, there is no opportunity for scale use bias and can be used for global studies. The trade-off techniques used in MaxDiff are robust and easy to apply. The resulting attribute scores are easy to interpret as they can be placed on a 0 to 100 point common scale and sum to 100.
The advantages of MaxDiff analysis
-
Easy for respondents
-
Brand preference
-
Culturally invariant
-
Customer satisfaction
-
No scale bias
-
Robust mechanism
-
Implements tradeoff
-
Powerful data for prediction and cluster analysis
MaxDiff Example
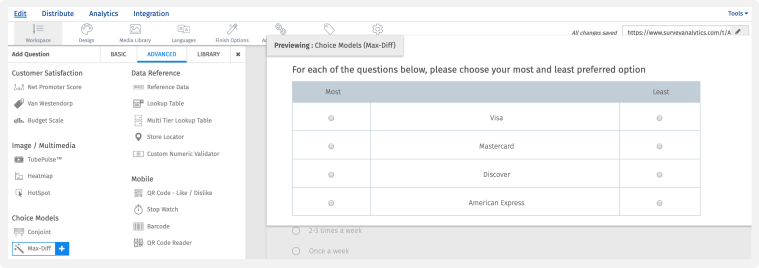
To set up the smartphone MaxDiff project, SurveyAnalytics offers the following tools and steps:
- Under Edit Survey and Workspace, click on the Add New Question and select the MaxDiff from under Advanced question types.
This will open the wizard-based MaxDiff question template to and and edit attributes.
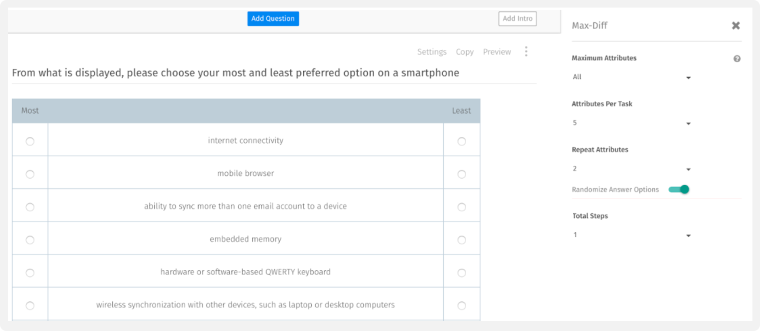
- Enter the attributes within the template and open up settings in the top right hand corner of the question template to specify how many attributes to use,
the number of attributes to show at a time, and whether to randomize these attributes.
The number of task counts shown to each respondent is based on the total number of attributes tested and how many you wish to show at a time.
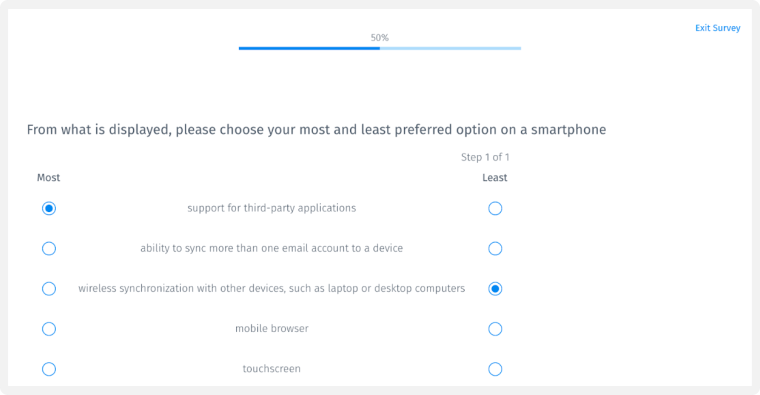
- Select preview to review the user experience and make changes until you are satisfied your MaxDiff question
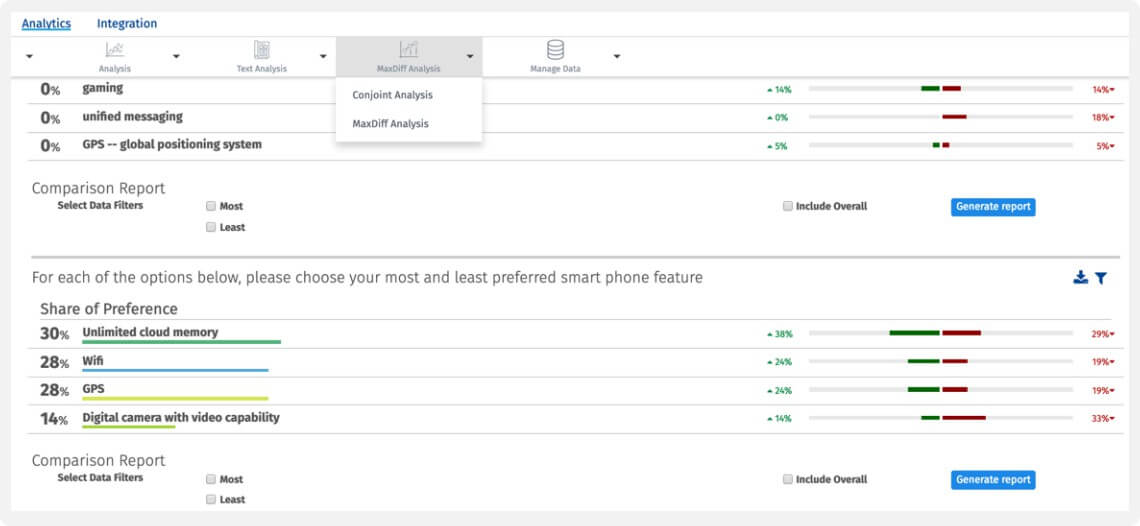
- After data has been collected from respondents, begin analyzing it by reviewing the following data points that tells the story of why your your target
audience prefer certain attributes most and least. There are five analysis and download options available for MaxDiff results in SurveyAnalytics:
-
Counts
The simple counts can be expressed through percentages or a sum that adds up to 100 that represents the number of times the item was selected ‘most’ or ‘least.’ These can be ordered and reported. Some analysts like to show the difference between the number of times an attribute was selected most vs selected least.
-
Utilities
Logit and hierarchical bayes methods gives each attribute tested a ‘utility.’ Generally speaking, this is a measure of how strongly the attribute contributes to a decision.
-
Share of utility
The utilities can be rescaled and converted into probabilities. This can be used to give the weight of each attribute. Segmentation - Respondent-level utilities can be further analyzed through the setting up segmentation and filter options within the platform.
-
Raw data download options
Available for export to expert analysis tools via SPSS, XML, and other formats. Click the filter and download
-
Customize and segment results
Update the online dashboard settings to view the share of preference results in different chart types

-
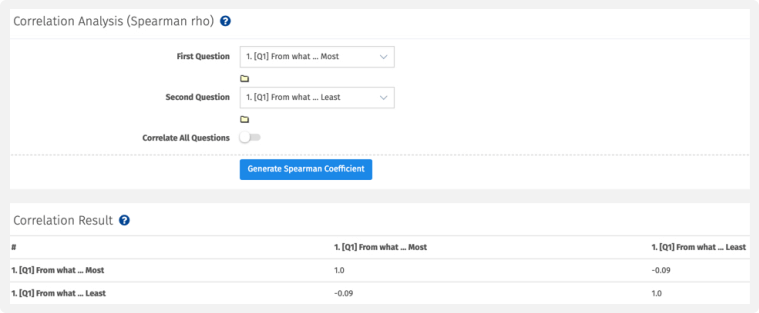
Apply advanced analytics
Run a correlation analysis, trend report, pivot tables, segmentation, and more to drill deeper into your results
Please fill out the form to get in touch with Survey Analytics. We will follow up within one business day.


